infographics

Not everything makes for an effective infographic. It takes an experienced writing, data, and design team to ensure that your audience understands your data as well as you do. With years of experience working with journalists and researchers to create effective data visualizations, we take the time to understand your data and your audience, providing you with expert advice based on best data visualization practices.

research/policy

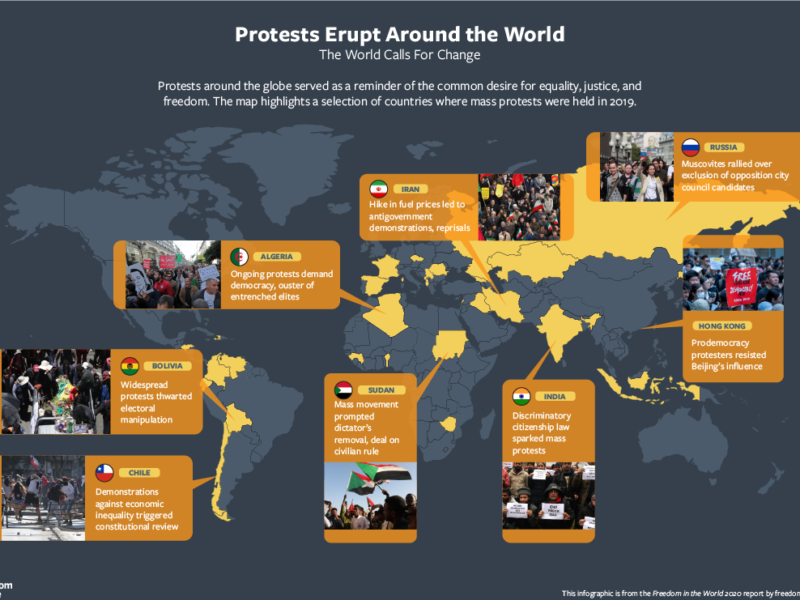
Infographic: Freedom House – Protests Erupt Around the World

Infographic: Freedom House – Protests Erupt Around the World

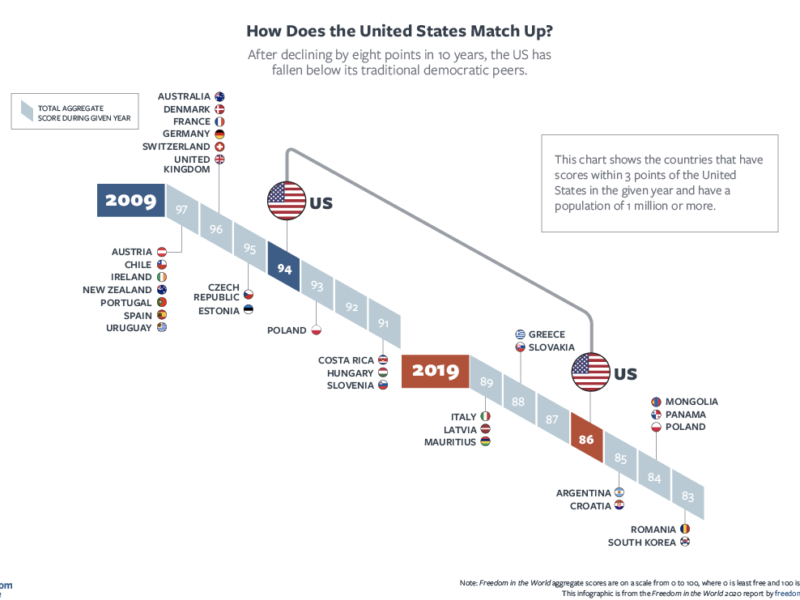
Infographic: Freedom House – How Does the United States Match Up?

Infographic: Freedom House – How Does the United States Match Up?

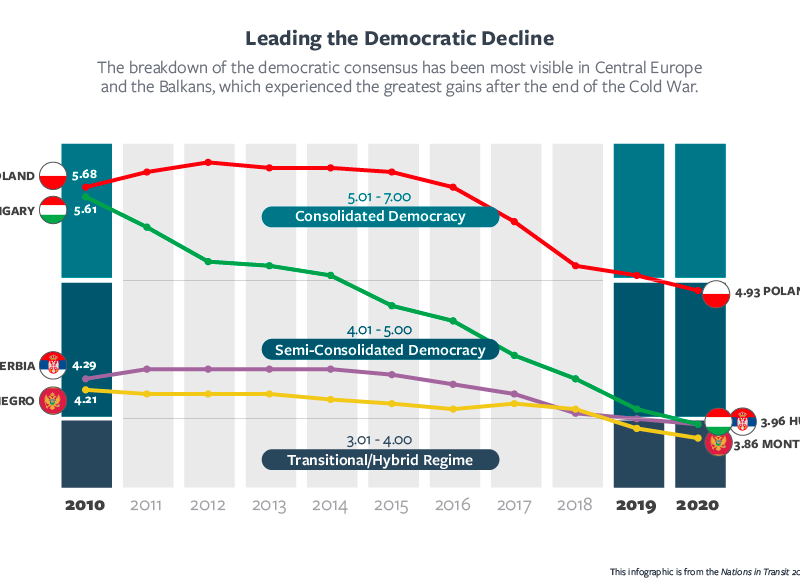
Infographic: Freedom House – Leading the Democratic Decline

Infographic: Freedom House – Leading the Democratic Decline

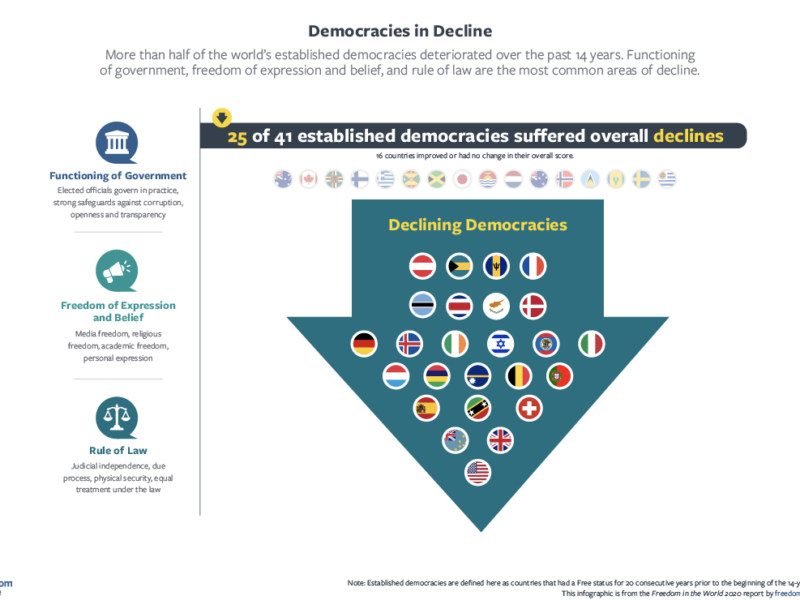
Infographic: Freedom House – Democracies in Decline

Infographic: Freedom House – Democracies in Decline

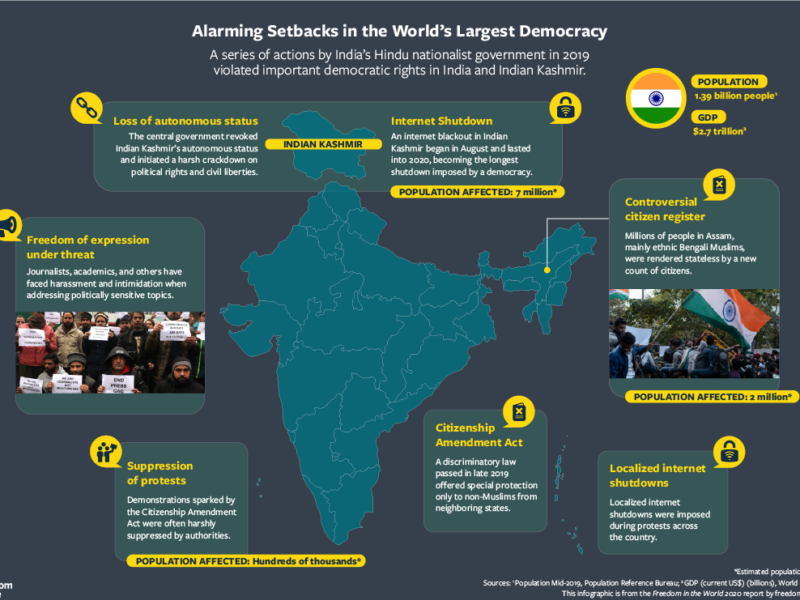
Infographic: Freedom House – Alarming Setbacks in the World’s Largest Democracy

Infographic: Freedom House – Alarming Setbacks in the World’s Largest Democracy

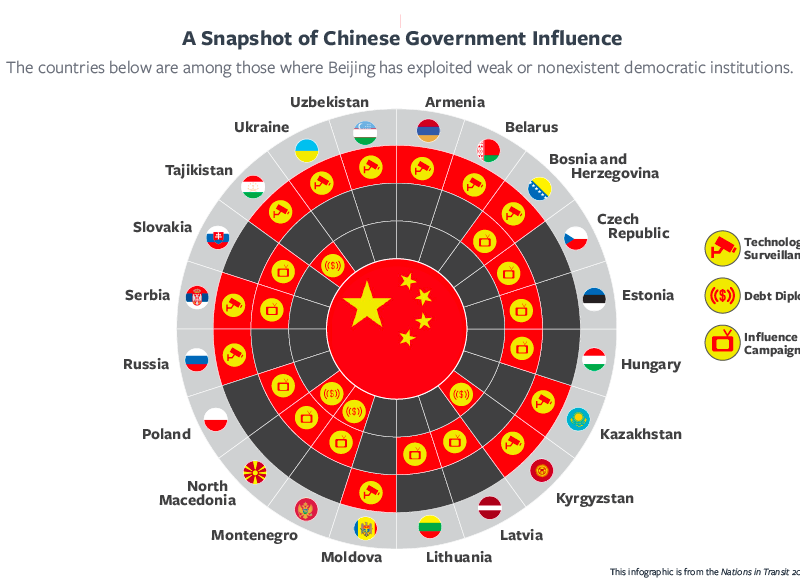
Infographic: Freedom House – A Snapshot of Chinese Government Influence

Infographic: Freedom House – A Snapshot of Chinese Government Influence

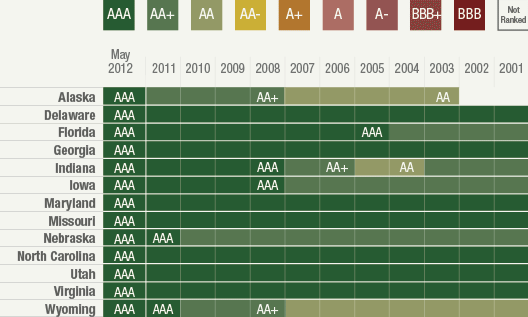
Infographic: Stateline – State credit ratings

Infographic: Stateline – State credit ratings

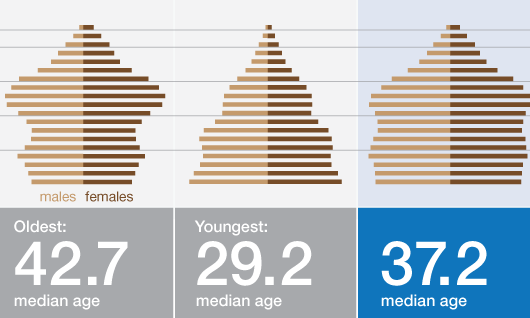
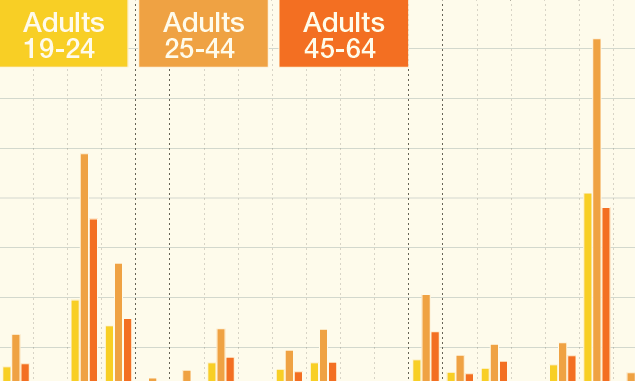
Infographic: Stateline – The aging states of America

Infographic: Stateline – The aging states of America

Infographic: FamiliesUSA – Medicaid expansion

Infographic: FamiliesUSA – Medicaid expansion

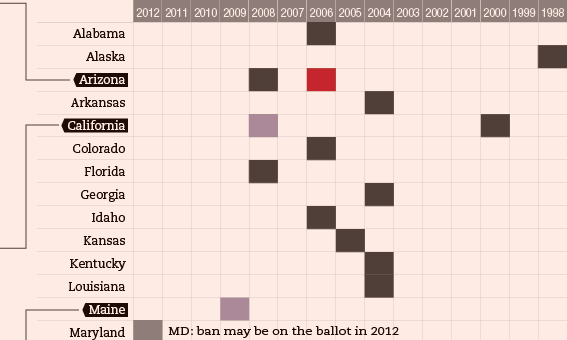
Infographic: Stateline – The gay marriage landscape

Infographic: Stateline – The gay marriage landscape

Infographic: Stateline – Changes in U.S. employment

Infographic: Stateline – Changes in U.S. employment

Infographic: Stateline – Voting patterns

Infographic: Stateline – Voting patterns

corporate

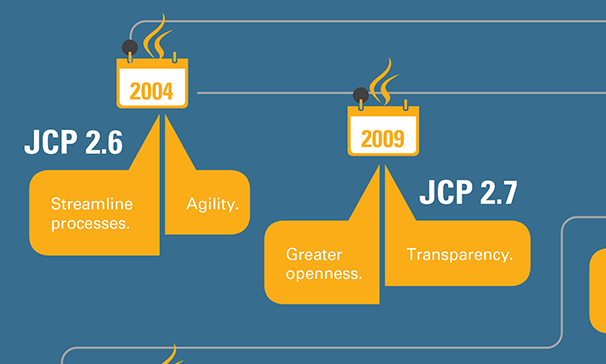
Infographic: Java – Collaborative evolution

Infographic: Java – Collaborative evolution

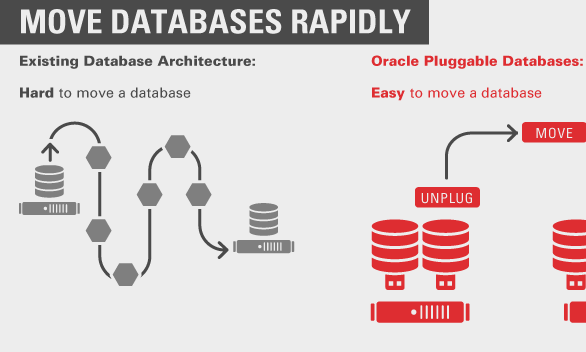
Infographic: Oracle: Pluggable databases

Infographic: Oracle: Pluggable databases

Infographic: Snapdragon – How processors bring your phone to life

Infographic: Snapdragon – How processors bring your phone to life

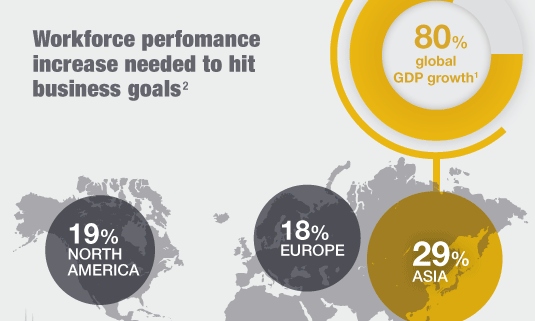
Infographic: CEB – HR risks in Asia

Infographic: CEB – HR risks in Asia

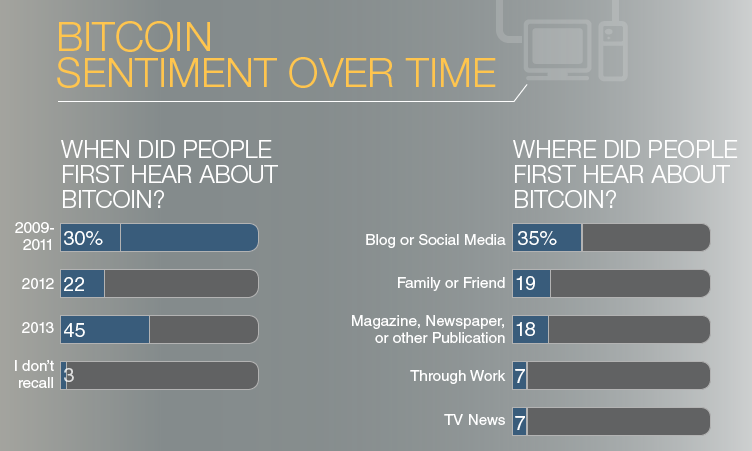
Infographic: Bitcoin Investment Trust – Bitcoin Survey Data

Infographic: Bitcoin Investment Trust – Bitcoin Survey Data

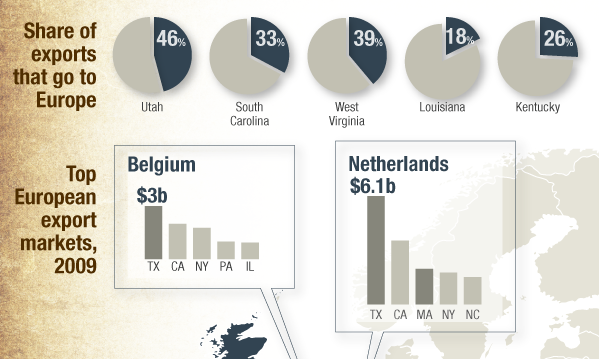
Infographic: Stateline – European recession and state economies

Infographic: Stateline – European recession and state economies

consumer-facing

Infographic: Truth Initiative – Tobacco companies lied

Infographic: Truth Initiative – Tobacco companies lied

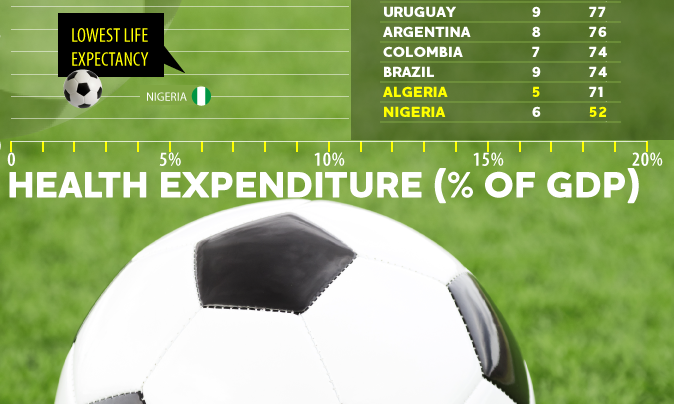
Infographic: FamiliesUSA – Here’s to a healthy World Cup

Infographic: FamiliesUSA – Here’s to a healthy World Cup

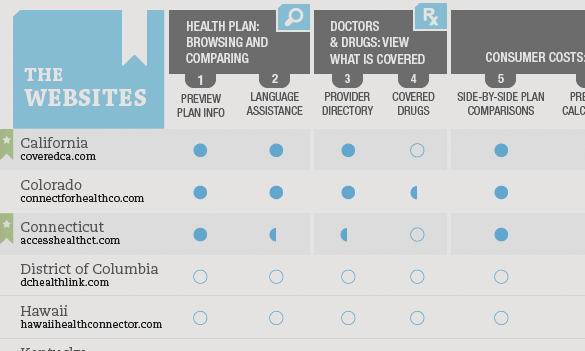
Infographic: FamiliesUSA – Health insurance marketplace

Infographic: FamiliesUSA – Health insurance marketplace

Infographic: FamiliesUSA – Health insurance enrollment

Infographic: FamiliesUSA – Health insurance enrollment

Infographic: Australian Healthcare Service – Private health insurance explained

Infographic: Australian Healthcare Service – Private health insurance explained

Infographic: FamiliesUSA – Comparing health insurance plans

Infographic: FamiliesUSA – Comparing health insurance plans

advocacy/nonprofit

Infographic: FamiliesUSA – CHIP Funding

Infographic: FamiliesUSA – CHIP Funding

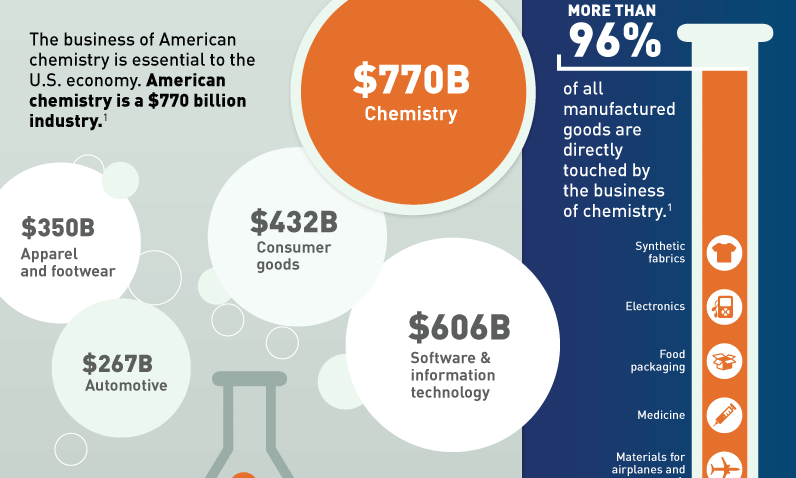
Infographic: American Chemistry – The cornerstone of our economy

Infographic: American Chemistry – The cornerstone of our economy

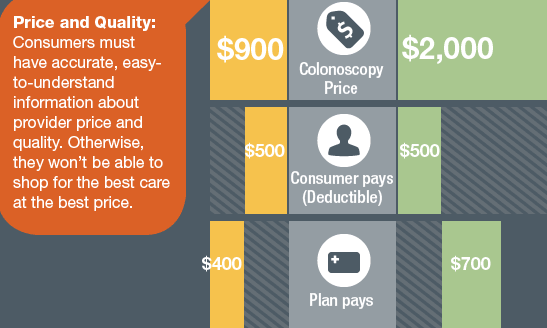
Infographic: FamiliesUSA – Health plans and reference pricing

Infographic: FamiliesUSA – Health plans and reference pricing

Infographic: Pew – Dental provider shortage

Infographic: Pew – Dental provider shortage

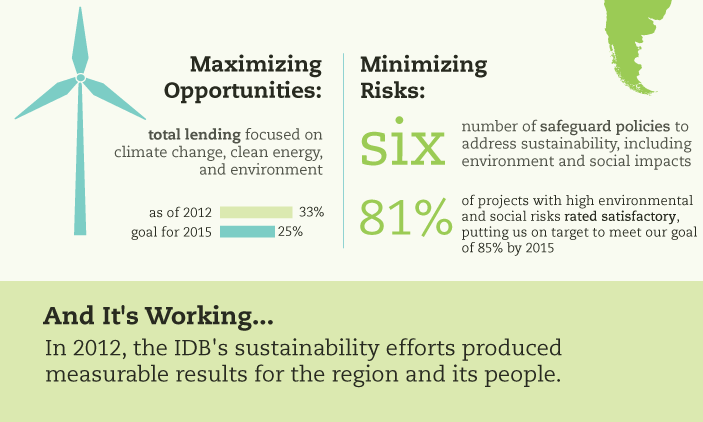
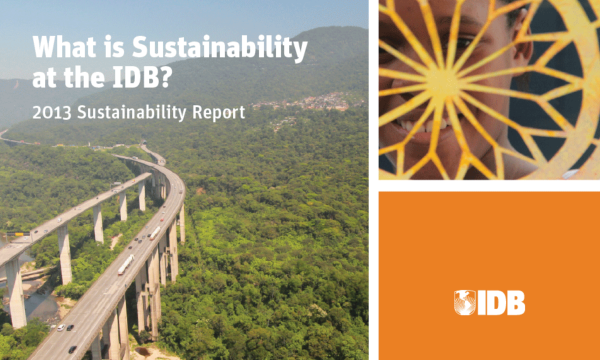
Infographic: IDB – Sustainability in Latin America and the Caribbean

Infographic: IDB – Sustainability in Latin America and the Caribbean

Infographic: Pew – Australia ocean protection

Infographic: Pew – Australia ocean protection

branding

Our experience leading organizations through 360 rebranding projects has taught us that listening—and then absorbing—the organizational culture and voice is as important as creativity. You can also count on our candid outsider feedback to help you balance your internal perspectives and bring voice to your audience needs.

case study:

Council for a Strong America is an early childhood advocacy and research nonprofit comprising 6 organizations. We developed an identity system for both print and digital—from a brand book to infographics and research reports. We also launched a new branded url and social media channels.

logos

Logo: TrueTree

Logo: TrueTree

Logo: Stop Bad Apple Gun Dealers

Logo: Stop Bad Apple Gun Dealers

Logo: Bandit Biscuit Works

Logo: Bandit Biscuit Works

Logo: FarPeaks Consulting

Logo: FarPeaks Consulting

Logo: Computational Physics

Logo: Computational Physics

Logo: Council for a Strong America

Logo: Council for a Strong America

Logo: Green Financing Solutions

Logo: Green Financing Solutions

Logo: GVPedia

Logo: GVPedia

Logo: redbolt studio

Logo: redbolt studio

Logo: A More Perfect Union

Logo: A More Perfect Union

Logo: FamiliesUSA

Logo: FamiliesUSA

Logo: Citizen Circle

Logo: Citizen Circle

graphic design

Our bread and butter will always be graphic design. We design products ranging from infographics and social media graphics to research reports, annual reports, and marketing collateral (check out our latest favorite t-shirt here). And because we’re also digital strategists, we can help you transform that content into great digital products that will engage your audiences online.

marketing & reports

Report: Truth Initiative-Laws of Tobacco Nation

Report: Truth Initiative-Laws of Tobacco Nation

Report: Ruesch Annual Report 2018

Report: Ruesch Annual Report 2018

Report: Blue Cross and Blue Shield of Louisiana – Health movement

Report: Blue Cross and Blue Shield of Louisiana – Health movement

Report: Allego-Assessing Sales Rep Competency

Report: Allego-Assessing Sales Rep Competency

Marketing: Mitsubishi Electric – Solar Decathlon Brochure

Marketing: Mitsubishi Electric – Solar Decathlon Brochure

Report: Senseware – Combating building automation obsolescence ebook

Report: Senseware – Combating building automation obsolescence ebook

Report: Truth Initiative-Campus Implementation Guide

Report: Truth Initiative-Campus Implementation Guide

Report: Granicus – Email Marketing Benchmarks

Report: Granicus – Email Marketing Benchmarks

Report: Granicus – Rebuild Trust in the Public Sector

Report: Granicus – Rebuild Trust in the Public Sector

Report: Brady 2018 National Electoral Report

Report: Brady 2018 National Electoral Report

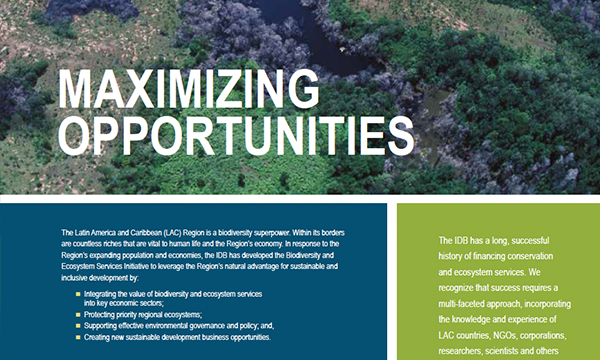
Marketing: IDB – Biodiversity and ecosystem services flyer

Marketing: IDB – Biodiversity and ecosystem services flyer

Report: Metalogix – The Definitive Guide to Better SharePoint Migration Planning

Report: Metalogix – The Definitive Guide to Better SharePoint Migration Planning

Report: Metalogix – Five Pillars to Optimize O365 Readiness

Report: Metalogix – Five Pillars to Optimize O365 Readiness

Report: GWBOT Smart Region Movement

Report: GWBOT Smart Region Movement

Report: Pew – Unemployment interactive chartbook

Report: Pew – Unemployment interactive chartbook

Report: Brady Annual Report 2018

Report: Brady Annual Report 2018

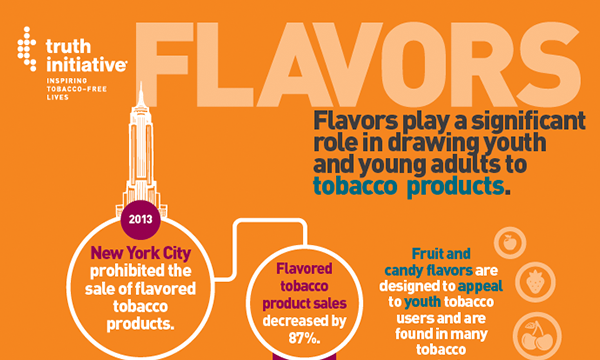
Report: Truth Initiative-Flavors

Report: Truth Initiative-Flavors

Marketing: GI Cancers Alliance Poster

Marketing: GI Cancers Alliance Poster

social media graphics

motion graphics

presentations

Portfolio: Presentations

Portfolio: Presentations