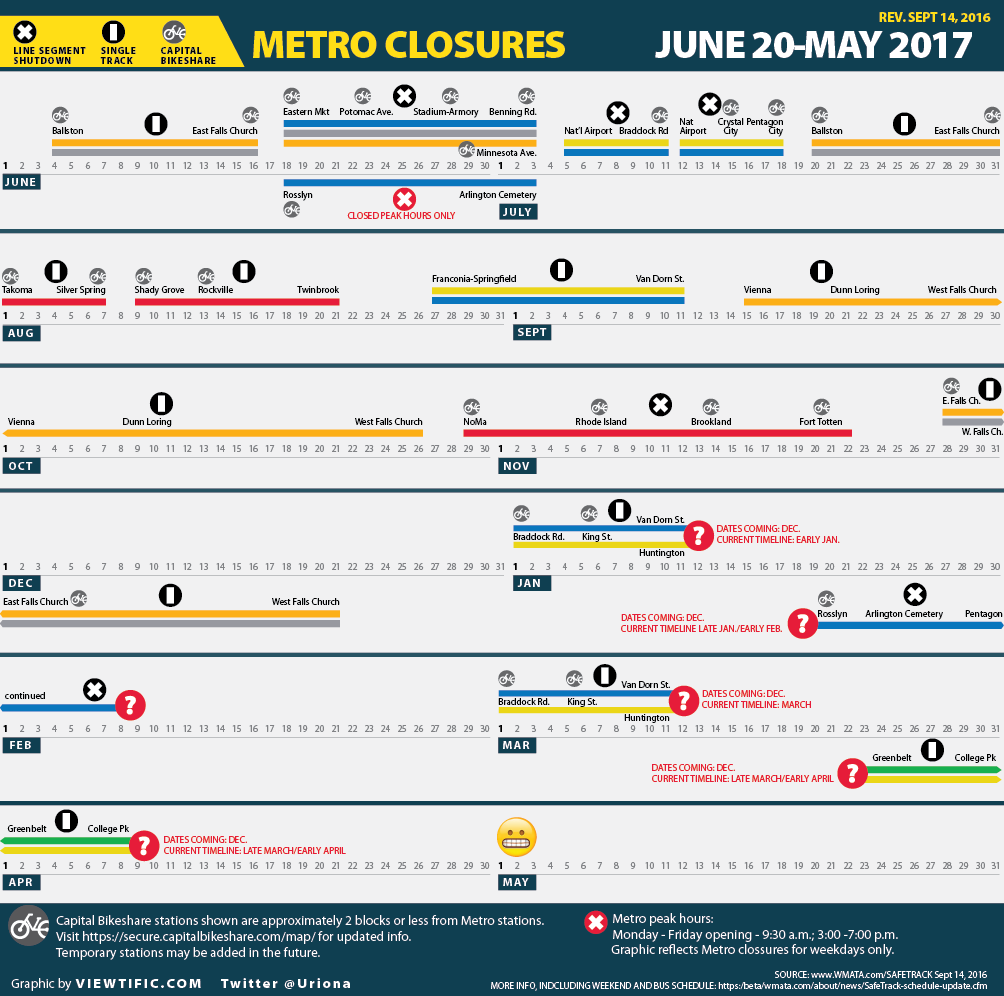
DC Metro Safetrack closures and Capital Bikeshare options for June 2016-May 2017 (rev. September 14, 2016)
[Updated Sept 14, 2016. Click on the graphic for a full-size render.]
Why this graphic?
If you live in or near the District of Columbia, you are plagued by the quirky, antiquated subway system that chugs along like the well-meaning and mildly embarrassing relative that everyone tolerates and continues inviting to family functions.
And if you choose to bike, PLEASE WEAR A HELMET!!!
I’ll keep it updated, but if you notice any mistakes or omissions, or want the original file to publish/share, email me at curiona at gmail dot com or Tweet me via @uriona.
Here’s what the Post designed previously:
Screenshot Washington Post Graphic of Metro Closures May 2016
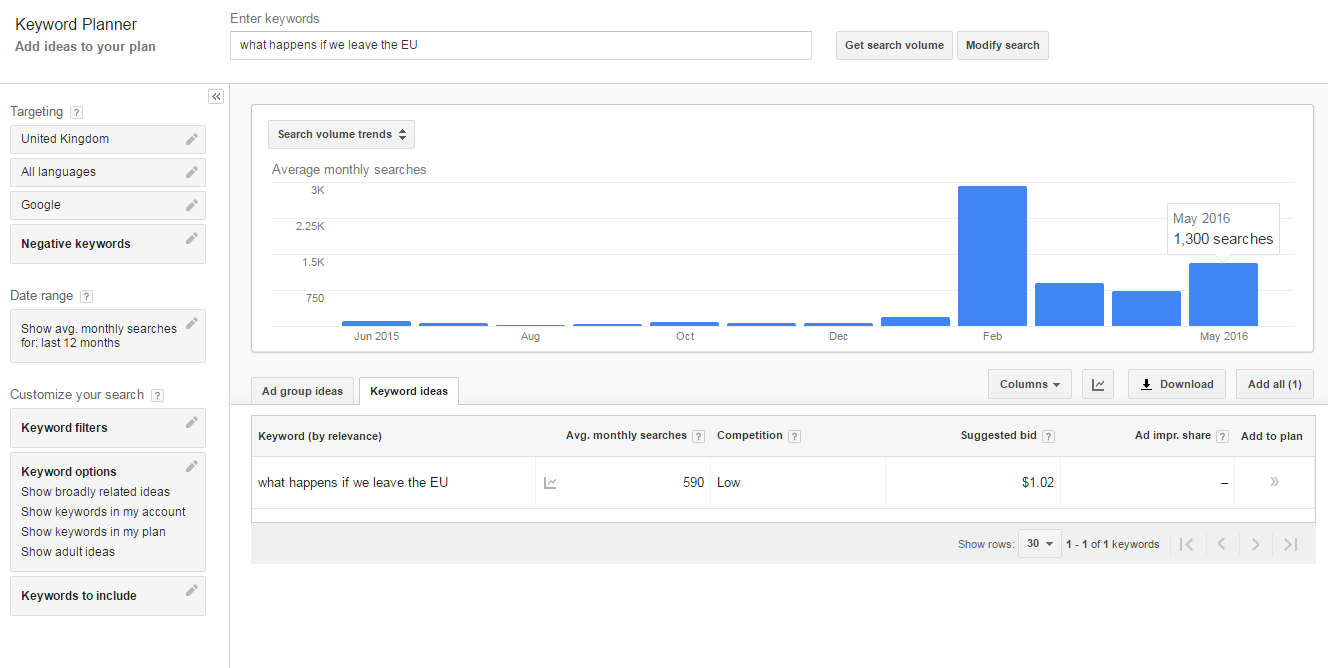
When last week’s Brexit-related “What is the EU?” Google story hijacked our collective social feeds with the strident persistence of a carnival barker, it sounded too good to be true, what with the story playing so nicely into the global narrative of xenophobic working class louts rising up, and all.
I made a mental note to check the numbers out before sharing on my own feed because, as a social media slash digital-type worker bee, I know how hard it is to draw sound conclusions from social media and search behavior (remember the epic misreporting of Google searches and flu trends?)
Screenshot of competing headlines on Brexit Google searches
This is particularly worrisome when the conclusions you draw feed into a social conversation already rife with misinterpretations of facts, and willful mischaracterizations of large groups of people. Specifically, please refer to my tongue-in-cheek characterization of Trump and Brexit “leave” supporters above.
Those who report on and interpret data wield a lot of power these days. Specifically, the emotional power to reinforce biases in a time when tensions and incivility are very efficient breeding grounds for the quick acceptance of stereotypes based on personal bias, repetition, and little time or inclination for independent verification of facts.
1. The Brexit GoogleTrends tweet plays on the immediacy of the situation and our emotions.
Telling us “in the last hour” heightens the immediacy of the news. “Spike” infers high numbers more than percentage increase, doesn’t it? This immediacy heightens our emotions and encourages us to skip past the obvious (see below) and focus on the what the author is telling us right now. We put our skepticism and critical thinking on hold in exchange for the savoury headline.
2. This play on emotions makes it easier for casual readers to mistakenly infer percentage increase with a high quantity.
This happens ALL THE TIME. As you know, a 250 percent spike is only relevant when you understand what the base quantity is. As in, were there 100 searches before and now there are 350? That’s a 250 percentage increase, but hardly one worth noting compared to the 52 percent of voters who voted to leave (out of the more than 30 million who voted in the Brexit referendum).
So. How many people are we talking about with this 250 percent increase? One blog reports 1,000. Yep. 1,000.
As several bloggers have pointed out by now, GoogleTrends just measures the relative increase/decrease of search terms over time, but not the amount. Steve Patterson instead searched on Google AdWords, which does actually count. Using that, you get closer to slightly less than a thousand, according to his calculations, and that of Remy Smith.
Patterson takes the Washington Post to task for misreporting the actual search term, which lowers the numbers even more (see his graphic, below and the original post here):
This graphic, originally posted by Steve Patterson, shows the correct Brexit-related search phrasing reported by GoogleTrends and even lower numbers of people who searched the term.
3. We are mistakenly inferring that those who voted to leave the EU are those who searched “what happens if we leave the EU?”
How do we even know that the people who searched the consequences of leaving are the same people that voted to leave? Isn’t it quite as reasonable to say that those in favor of staying are now searching to find out what will happen next? Or a mix?
Too quick to report, too slow to question: Worry about the real trend instead
So, another disappointing reminder that the emotional nature of social media reporting of “facts” fuels our propensity to believe, to share, and to move on without fulling understanding what we’re propagating. And this is the real trend that I’m worried about, because it shapes public attitudes and opinions and threatens our ability to see and understand information based on facts versus what we’d like to believe. Given the uncivil nature of public discourse these days, that’s a dangerous proposition.
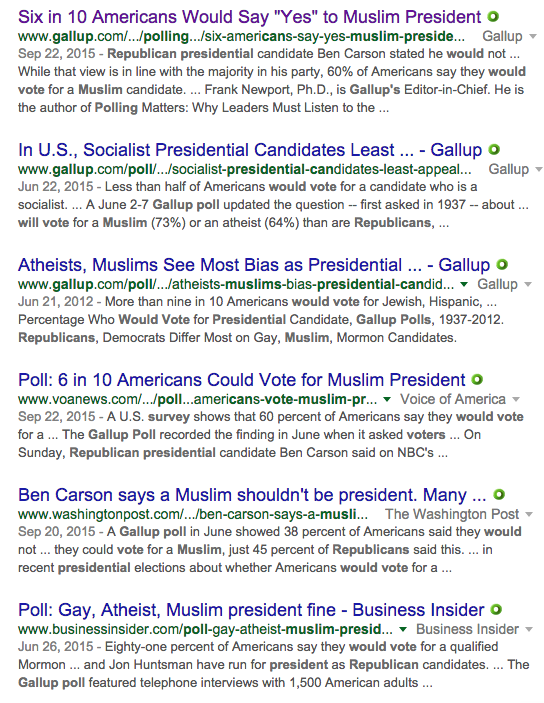
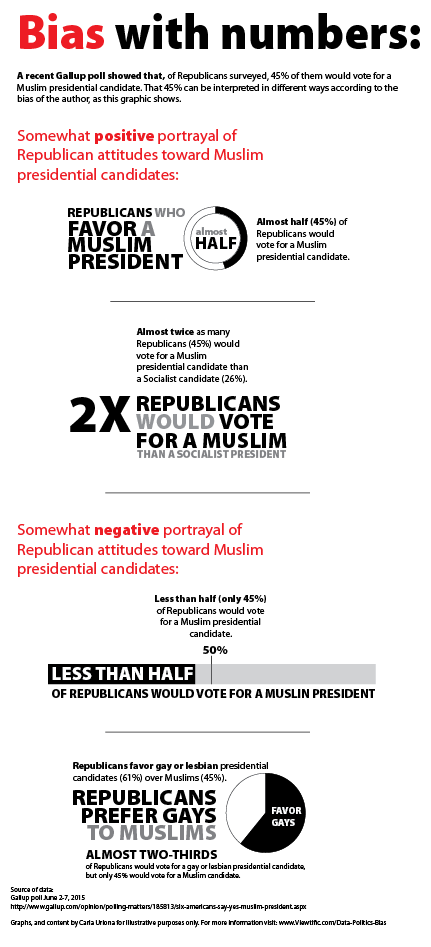
Those are just a few recent examples (regardless of how you feel about guns or Planned Parenthood), that illustrate how challenging it is for the casual reader to get unbiased reporting when it comes to statistics. But this this time I couldn’t stop myself from having a little fun with the Gallup poll by designing an infographic to illustrate the findings of Republicans toward Muslims in different ways. Enjoy. Or weep.
An illustration of various ways statistics can be interpreted.
Well, it’s not quite data visualization, or journalism. Every now and then (see gay marriage), I editorialize. Today is one of those days. Because yesterday, many Bolivians and supporters from around Latin America and other countries rallied around the cause of Bolivia’s access to the sea. Below is a Storify that I quickly put together to give you a sense of what the campaign was about. I was born in Bolivia and have seen firsthand the poverty and hardship that many in this small, landlocked country endure. As @YeseniaR_94 says below, “I can’t say that #Bolivia regaining access to the sea will solve all its problems, but it’s a start.” I guess that I feel the same way. As do some, not all Bolivians, Chileans, Peruvians, Venezuelans, etc. If you want to learn more, you can read about recent developments here via the Wall Street Journal, the Pope (sort of), the Hague (that didn’t pan out), and Wikipedia. Future posts will return to more relevant topics of dataviz and journalism, promise!
Numbers are so, weird. They lack emotion, judgement, subjectivity. And yet they are reflections of ourselves. And we are so willing to manipulate them, fight over them, use them to control one another. They are the good and the bad in us. I know you know this.
But this week, I was reminded of this yet again, when I tried to count states and draw a map.
It was a really tough week. On Wednesday, the Supreme Court heard oral arguments on the King v. Burwell case. That’s a case that will decide whether the feds get to continue giving the subsidies that help people pay for healthcare in a whole bunch of states (Did you get the “a whole bunch” bit? Hold on to that). You can read about the case on Vox in a really good explainer here. Even Michael Cannon likes it (and he doesn’t like the ACA much), except for these parts.
Numbers really matter in this case, and I want to talk about them, but perhaps not in the way that you think. You might be thinking that I’m about to make the case that the people in the states at risk won’t be able to pay for health insurance if they lose subsidies, and that I’m about to show you those numbers, but I’m not. That’s my day job.
How many states would lose subsidies if the Supreme Court decides in favor of the plaintiffs in King v. Burwell?
I want to talk to you about numbers in a different way. Here they are:
37
34
two-thirds
three-dozen
“more than 30”
The numbers above illustrate some of the ways in which different sources (news outlets, pundits, policy experts, advocates, my mom… okay, not my mom… but I bet she’d have an opinion if I asked her) are reporting the number of states that could or would (yes, that distinction is important) lose subsidies if the Supreme Court decides to take them away.
I was trying to design an infographic to illustrate how many states were at risk of losing these subsidies. I figured on about 45 minutes to create a map and a bar chart. But I couldn’t. Because there wasn’t a number. Or rather, because there were many. And each number was more loaded than the rest.
How many states would lose subsidies if the Supreme Court decides in favor of the plaintiffs in King v. Burwell? It’s like the beginning of a “How many people does it take to screw in a lightbulb…” joke. Except there’s no punchline because it’s not funny—families get to lose their health insurance over this one.
So my straightforward question took me down a long, sad rabbit hole of politics, healthcare, and the Supreme Court.
Seriously, how do you count states?
To understand why these numbers matter, you need a basic understanding of how the healthcare exchanges are structured. Bear with me for four sentences. Under the ACA, each state plus the District gets to choose whether to set up its own health insurance exchange or to let the feds do it:
If the state sets up its own exchange, it’s called a state-based marketplace and there are 14 (including DC)
If the state lets the government do it, it’s called a federally facilitated marketplace and there are 27
If the above two categories were it we’d be all squared away, just a knock-down-drag out fight over people trying to take healthcare away from low- to- middle-income people. No numbers involved. But there’s a gray area with states that have partnerships—and not everyone agrees which of the above categories these gray states could fall into if the ruling goes down.
Some state exchanges are called partnerships (a state-partnership marketplace and there are 7 to be painfully precise). This is where the states and the feds divvy up the work of administering the exchange and the whole thing is run off the federal website—healthcare.gov
There are also states that do all the heavy lifting of administration and just use healthcare.gov as a technology platform. They basically have a state-based marketplace but happen to run it off the fed website—Oregon, Nevada, New Mexico. (If you are a glutton for wonk terms this is called a federally supported state-based marketplace and there are 3 of these states).
Why is the number of states so important in King v. Burwell
Now, the lawsuit in King is basically an argument over which states with which types of exchanges get to give subsidies. The plaintiffs claim that the law intended for subsidies to be provided only to states that run their own exchanges (state-based marketplaces). That requires a definition: What, exactly, is a state that runs its own exchange? And a number: How many states do that?
Then there are those three “gray area” states in play (Oregon, Nevada, New Mexico) that make counting things more complicated: Do they/don’t they meet criteria for being state-based marketplaces? Depending on who you ask, they’re either at risk (see above) or doing just fine, thank-you-very-much (see above). (I know people that would run me out of town for even asking that question. To those people I say, “Yes. They are state-based marketplaces. But not everybody agrees with you. See above.”)
Because depending on how the lawsuit goes, which state counts as a state-run marketplace affects who gets subsidies and who doesn’t, either through how the court defines it or how the rules define it after a decision gets handed down. I don’t have the brainpower or the will to begin to cover the arguments in this blog, so I won’t attempt to do so. But it matters. Just ask the people who won’t be able to afford health insurance once they lose their subsidies.
So we have a situation where prominent sources are reporting the numbers differently, and it’s confusing, and it’s political.
These numbers are being reported very differently by, um, everyone. Not just proponents and opponents of the law. Everyone.
Some count 13 states plus DC as having exchanges with “state-based marketplaces”, which means that they report 37 states at risk of losing subsidies.
Others count the 13 states plus DC and also what I call the three other “gray area” states (Oregon, Nevada, New Mexico).
Others use more nebulous characterizations (see below).
Here’s a sampling of the most common reporting that you’ve likely seen already:
34: New York Times reports 34 states for sure with three unclear (Oregon, Nevada, New Mexico). Accordingly, the map highlights 37 states at risk with just 13 “safe” states plus DC, describing these 14 as “states that have their own exchanges and would not be affected by any ruling”
So why can’t a poor designer simply catch a break and just draw a map?
Well, politics, obviously. That’s part of the point of this post. To shed light on just how murky things get for the people whose job it is to make things…er… clear.
If you’ve got a day job, drawing a map can mean visualizing—not data—but the political stance of your organization.
You’re caught in the cross-fire between your craft—show what you see/know—and the advocacy goals of your organization. Or, for that matter, the politics of the issue itself independent of your organization. Things don’t always align neatly.
Oh, by the way, I did draw the map for this blog post. Please enjoy it.
It’s complicated. But there’s another catch.
And can I just say one more thing? This is a shameless plug for my own outfit. If you really are interested in what will happen to the people who will lose their subsidies (I’m totally serious), please watch this video. Regardless of what “number” we ultimately settle on, not much good will come of it if these families lose their subsidies and can’t afford to pay for health insurance. You can hear them tell you about it in their own words. It’s pretty compelling and yes, we produced it.
When putting my son to bed at night, I ask him: “Which do you want to do first, brush your teeth, or put on your pajamas?”
If this was a properly worded survey question, I’d also throw in an “other” option. But it’s not a survey—it’s me faking out my kid to force him into choosing one of two choices that I want him to make. That’s okay for bedtimes and five-year-olds, but not okay for survey questions.
Surveys have a powerful grasp on public sentiment, leaving the public vulnerable to biases, flaws, and misinterpretation of the results.
Surveys have a lot of power to shape public thought. The relative brevity of survey questions—and the deceptive simplicity of their results—can confound the issues that surveys are meant to shed light on.
These issues are often nuanced and complex. Reducing them to survey questions can lead to misinterpretation of the facts if the surveys are improperly designed. This can skew how the public perceives the facts that shape their opinions and their actions.
And that can lead to erroneous conclusions from a public trained to think in sound bites, reporters eager for a good story, and policy makers and advocates seeking to bolster their cause.
Of course, there isn’t anything implicitly devious behind a survey—data can cause confusion in any form (remember the controversial gun graph from April, 2014?). But surveys are vulnerable to the biases, flaws, oversights, and limitations of those asking the questions.
Media, policy makers, and advocates need responsible survey reporting as much as the public needs survey literacy skills
To get to the facts, survey nerds, data wonks, and most journalists are used to getting up close and personal with how the survey was designed before using that data to draw wider conclusions.
But that’s a lot to ask of the average reader, and media outlets (along with anyone with the power to shape public opinion) also bear responsibility for scrutinizing survey results (and being transparent about the specific questions that were asked, the methodology, and the original source).
A recent Pew survey on gun control sentiment shows that even highly respected polling and research organizations can make mistakes
Recently, one of my favorite polling outfits, The Pew Research Center, came under scrutiny for crafting poorly worded survey questions about public attitudes on gun control in a survey entitled, “Growing Public Support for Gun Rights” (full disclosure, I was employed by Pew from 2008-2013).
The survey results showed an apparent rise in public support of gun control and were—predictably—hailed by those who favored the results and lambasted by those that didn’t.
Headlines by news outlets with differing political views told two different stories about the same gun control survey:
Here’s how media outlets handled the story:
The progressiveMother Jones: Is Protecting Gun Rights Really a Growing Priority for Americans?
The conservativeWashington Times : Support for gun rights at highest point in two decades
That’s par for the course in surveys, which are the go-to political football of pundits and the American public.
Putting politics aside, however, it’s fair to say that critics of the survey had a point when they claimed that the survey questions were poorly worded.
The survey questions asked respondents whether it was more important to “control gun ownership” or to “protect the right of Americans to own guns.” But that was a false dichotomy.
The gun control survey questions present respondents with a false dichotomy, a choice between two options that are NOT the mutually exclusive choices that the questions make them seem (one can obviously be in favor of gun control AND in support the right of Americans to bear arms).
Media Matters (a self-described progressive non-profit that monitors conservative media) and the New York Times were among many of the media outlets who questioned whether the survey questions were properly worded. Both reported the comments of Daniel Webster, the director of the Center for Gun Policy and Research at Johns Hopkins:
“I could not think of a worse way to ask questions about public opinions about gun policies.”
“Pew’s question presents one side emphasizing the protection of individual rights versus restricting gun ownership. The question’s implicit and incorrect assumption is that regulations of gun sales infringe on gun owners’ rights and control their ability to own guns.”
“The reality is that the vast majority of gun laws restrict the ability of criminals and other dangerous people to get guns and place minimal burdens on potential gun purchasers such as undergoing a background check. Such policies enjoy overwhelming public support.” —Daniel Webster, Johns Hopkins Center for Gun Policy and Research.
I’m not sure what the moral of this story is. I do know that it can be tough for a layperson bombarded by so-called “data” to discern the facts. Data literacy can help. And by scrutinzing surveys that produce unclear results, reporters and those who influence the public can make that job a little easier.
Resources on proper survey methods
If you’re interested, the National Council on Public Polls produced guidelines for journalists and polling (20 Questions A Journalist Should Ask About Poll Results), which is a pretty good resource that has often been cited. There’s plenty of other stuff out there too, including the survey guidelines put out by the good folks at Pew Research Center themselves. I learned quite a lot from this post as well (The Good, the Bad, and the Ugly of Public Opinion Polls), written by a retired professor of political science.
And now advocacy organizations are getting into the mix. They’re taking the reins by exposing, researching and writing about the issues they care about in a genre of journalism known as advocacy journalism. Advocacy journalism has been around for a while (remember muckraking?). But today’s digital landscape seems ripe for innovation by those that want to take the genre further.
A recent article by Dan Gillmor in Slate’s Future tense project provides a thought-provoking and current look at the nexus of advocacy and journalism today, one that made me want to dig a little deeper into the subject to see where the field is at and what hurdles it faces.
Advocacy journalism is an interesting genre. On the one hand, it seems like a big deal—by injecting a point of view, it appears, at first blush, to upend the sacrosanct “objective reporting” model that is the foundation of traditional journalism. But in fact, today’s so-called traditional journalism is itself rife with points of view (reporters are human, after all, and routinely bring their personal perspectives to the questions they ask and the subjects they cover).
It’s no coincidence that, at the same time as advocacy journalism is getting more attention, investigative reporting in traditional media—the bread and butter of deep, immersive journalism—is diminishing due to shrinking newsroom budgets, capacity, and interest. (The American Journalism Review wrote about it in 2010, and things don’t look that much rosier if you read about revenues and ad dollars in Pew Research Center’s State of the News Media, 2014 report or the internet marketing firm Vocus’s 2014 State of the Media.)
So, resources for investigative reporting in traditional media may be diminishing, but the need itself certainly hasn’t. The immediacy of the internet and social media reporting make the gaps left by traditional news organizations more transparent than ever before. It has opened up the playing field for those who want, and need, to write about social change, and see advocacy journalism as yet another tool for driving that change. It is here that advocacy organizations are stepping in.
Gillmor mentions the Upworthy partnership with Human Rights Watch, Climate Nexus and ProPublica, but he also reminds us of the work of the libertarian Cato Institute, and the ACLU, noting that these organizations are not just writing about their issues—they have invested in hiring talented, investigative journalists to do the work.
One of my earlier posts this year discusses how advocacy organizations are harnessing social media to effect social change on their own terms (I wrote about the MIT Center for Civic Media’s study of the media coverage of the Travyon Martin tragedy, and of how it was framed and defined in part by digital-savvy advocacy organizations). In the same way, advocacy organizations are equipping themselves with investigative journalists to define the things that need fixing in our society, again, on their own terms.
Transparency and bias concerns apply to all reporting, not just advocacy journalism
As with any form of journalism (see a post that I wrote about the importance of trusted messengers correctly reporting the facts), there are always legitimate concerns around the ability of the “reporter” to be transparent about the perspective and bias that he or she brings to a story, especially when money comes into the picture (for example, a journalist embedded in an advocacy organization writing about an issue that is driven by a funder). But one can easily make the argument that journalism has never been immune to this predicament. Media brands are, after all, owned by corporations—remember Michael Bloomberg’s takeover of his newsroom and Murdoch’s editorial biases? The issue is not so much that money is paying for journalism (it always has). Rather, the issue is one of transparency and fairness (something Gillmor acknowledges in his online book, Mediactive).
Most recently, advocacy journalism was roundly dismissed by Buzzfeed’s Editor-in-Chief Ben Smith. When Eric Hippeau, a venture capitalist (and early investor in Buzzfeed), sat on a panel at the Columbia School of Journalism and asked Smith about the fine line between different forms of journalism and advocacy, Smith responded, “Um, yeah, I hate advocacy. Partly because I think, you know, telling people to be outraged about something is the least useful thing in the world.” (The video is here and and a good article with more on Buzzfeed is here.)
That’s kind of ironic given Buzzfeed’s public missteps and its association with the Koch brothers on the issue of immigration reform. I’m not saying that the partnership is in and of itself a concern (Slate’s Dave Weigel described it as a “pro-immigration reform” panel that was very much in keeping with the Koch brothers’ longstanding interest in the issue). But the association is not one to be ignored, either, particularly from a man who claims to hate advocacy. I’m still coming around to the idea that “Buzzfeed” and “journalism” can be conjoined. I don’t say that to be snarky—I say that to mean that all lines are blurring, including newstainment sites like Buzzfeed that are reinventing themselves in the digital journalism mold, whatever that is.
Medialens has a good take on the back-and-forth skepticism around advocacy journalism (“All Journalism is ‘Advocacy Journalism’ “) and offers some clear-eyed perspective by pointing to numerous examples of how ‘non’ advocacy journalism exhibits bias (ranging from uber-left Ira Glass’s omission of the U.S. role in Guatemalan genocide to Jeff Bezos’s 2013 purchase of the Washington Post alongside Amazon’s $600 million cloud-computing deal with the CIA—on the heels of its decision to stop hosting WikiLeaks in 2010).
Journalism is changing: traditional media gatekeepers are going away
As Gillmor points out (and as I’ve written written previously), back in the day, traditional media were largely gatekeepers to reporting. If you were an advocate or an organization with a story and a point of view, you had to get a reporter’s interest and rely on that person to pitch it to an editor. To stand the best chance of success, you had to do the research, get the facts straight, frame the narrative, and package it up so that a reporter could understand it, pick it up, and pitch it. Those days are disappearing, and in their place is a new frontier of blurry gray lines of people and perspectives, all vying for a chance to shape the news agenda of the next hour. Investigative reporting is what gives all of us perspective, makes us take a collective deep breath, and think beyond that next hour.
It’s unsettling, but also an opportunity to fill in the gaps left by the old guard, as long we do it right. So, what’s right?
Doing it right: some things should never change
I recall reading (and tweeting) about Upworthy’s announcement when I read Nieman Lab’s post last month. Given that I work in a policy and advocacy organization that has a keen interest in seeing its point of view accurately and widely expressed in the media, I myself wondered how we could inject ourselves into a similar partnership. And, if we could, what we would say, how we would separate our social passion from the hard and complicated truths that spell out complex political realities? For me, it raised more questions than I could answer. But it’s tremendously exciting to see where others are going.
I’ll be curious to see how (or if) these partnerships help fill the void left by the diminished investment in investigative reporting in traditional newsrooms. And I’m also eager to see what new best practices emerge as a result. But regardless of how things change, the responsibility of transparency has never been greater. And all of these changes add up to the same principles that should never, ever change in journalism—report the facts, be clear and transparent about your point of view, and tell people where your money is coming from.
When I lived in a dodgy part of Washington, D.C. in the early 90s, I used to get my food from either the pizza joint six blocks down the street, or Dottie’s Liquor on the corner of the dilapidated English basement that I called home. My hours were irregular (hey, I was young and having fun), but I could always count on Dottie’s Liquor to furnish more than a six-pack. I could buy high-fat, high-sodium canned concoctions called “soup” for 99 cents, sugary fruit drinks, and the occasional yellowed roll of toilet paper that the elderly African American cashier would silently pull off the dusty top shelf that hung precariously behind the counter. I didn’t care much about my diet—I was a bike messenger—I could burn off anything. And I never noticed the young Latino and African American families that would crowd the aisles (it was a small store, it only took one family to do that), with kids in tow. It never occurred to me that this was their grocery store because back then, there were no other options within walking distance.
As I got older, I began hearing about “food deserts,” pockets in low-income neighborhoods where a paucity of fresh food and vegetables was the norm. And what little quality food there was cost a fortune. The media coverage would typically feature a few quotes from a researcher and perhaps a food advocate, along with a reasonable-sounding statistic in support.
That framing fit neatly into my personal narrative. I found myself in quick agreement when food activists decried the situation. I never questioned the statistics, either. And when policy makers joined with grassroots campaigns to turn advocacy into policy, I supported it with a sense of satisfaction—in my lifetime, things were changing. Move over Dottie’s Liquor. Farmer’s market produce, come on in. And then, earlier this week, an article on Slate claims that food deserts do not exist—that the claims were made based on inaccurate interpretations of various research studies.
The psychology of data
The idea that by introducing healthy, fresh food one could measurably improve poor health outcomes in low-income populations seemed, not too good to be true, but rather too good to question. So, when Slate published their article questioning claims made about the existence of food deserts, I was surprised and disappointed.
And therein lies the psychology of data. When it proves something you agree with, how likely are you to question it? For a lay person, it’s a question of how well-informed we are. For a policy maker, the burden is much higher.
And the challenge we face, no matter how well informed we attempt to be as members of the general public, is that we are hostage to the facts that trusted messengers—among them, policy makers, journalists and advocates—put in front of us. (For a discussion of the designer’s role, read this previous post.) That’s a big responsibility for them, and the responsibility for us is to question them and hold them to it.
More important than debating the merits of whether or not food deserts truly exist, is examining how the claim of food deserts came to be proven and then disputed. It allows us to walk through the evolution of an idea from the ground up (from advocates, to policy makers, and back to us, the public), and understand the role that data and data literacy plays out across the different actors.
And that’s what this post is about.
Let’s take a quick look at the Slate article and a few of the studies that it references. These studies examine food deserts via the lens of health outcomes, diet and the availability and proximity of healthy food. According to Slate, the increase of healthy food initiatives (those aimed at reducing food deserts and thus, disparities in the health outcomes of low-income populations) has risen sharply in the U.S., due to the largely successful efforts of food activists who lobbied for fresh, affordable food in poor neighborhoods to reduce disparities in health outcomes of low-income people. The charge has even been taken up by Michele Obama.
How did food desert initiatives originate?
In Britain in the mid-90s, there were a few studies (note that Slate describes them as “preliminary”) that suggested that a “a link might exist between distance to a grocery store and the diets of poor people.” Already you can see how easily a well-intentioned health advocate or policy maker can jump to the conclusion that a correlation exists between poor health outcomes and lack of access to fresh, affordable food available from a local grocery store. And this is exactly what happened. The Slate article traces the history of the food desert movement. In a nutshell—a few studies in Britain in the 90s were followed by a Pennsylvania law in 2004 that funded fresh food programmes, followed in quick succession by adoption of similar programs in 22 U.S. states (to date), according to Slate.
But the data cited by advocates in these studies doesn’t entirely support that correlation. Here is a summary of a few studies that refute this (one of which is written by an author who wrote a study that is often misquoted).
A widely-cited study used to support the existence of food deserts is inconclusive
Researchers analyzed how often individuals ate fast food, how much of it they ate, the quality of their food diet, and how much they ate of fruits and vegetables, as well as the availability of fast food restaurants and supermarket grocery stores (measured at different distances). You can read the study for yourself—but it concluded that the evidence showing a correlation between bad food resources and poor diet and obesity are mixed, at best.
“Neighborhood supermarket and grocery store availability were generally unrelated to diet quality and adherence to fruit and vegetable recommendations, with similar associations across income levels.”
So as you can see, the conclusions from the JAMA study didn’t quite square with how they were being used by policy makers—other factors were at play. Low-income men were more apt to consume nearby fast food more (and, conversely, did have a better diet when there were supermarkets nearby), but low-income women were not statistically significant. Middle-income individuals showed varied significance (described by the researchers as “weak” and “inconsistent with significant counterintuitive associations in high-income respondents”).
Tensions between the aspirations of social change and the reality of evidence-based research
An essay in the Journal of Epidemiol Community Health, “Good intentions and received wisdom are not enough,” features a powerful (and damning) indictment of the touchy dynamic between the pressures of social change and the research that underscores it. From the authors:
“There is a common view amongst social and public health scientists that there is an evidence-based medicine juggernaut, a powerful, naive, and overweening attempt to impose an inappropriate narrow and medical model of experimentation onto a complex social world.”
The essay pointedly calls out the resistance (“hostility”) of social scientists, health policy makers and advocates to attempts by researchers to use the evidence-based approach traditionally used in medicine, but not public policy (systemic reviews of data or experimental designs, for example). Why? The authors of the essay claim that social change advocates view the real world as too messy and a far cry from the controlled environment of academic and medical research. This applies, the authors note, particularly to what I’ll describe as social issues of the day—issues where good intentions and raw emotions are at the surface as well-intentioned advocates and policy makers attempt to use data to alleviate the very real and valid human suffering that is so visible to all of us. Read it here.
Assertions quickly become facts in the public sphere
“Assertions can be reported so often that they are considered true (“factoids”). They may sometimes even be used to determine health policy when empirical information is lacking.”
It’s telling that this was written in 2002, approximately two years before the elimination of food deserts became a part of American public policy.
The paper attempts to track the rise of the food desert assertion in the UK. It points to three main UK studies that were frequently cited by advocates and policy makers (two are noted above) and systematically dismantles what it characterizes as erroneous assertions by advocates to correlate food deserts with poor health outcomes. How? You can read about it for yourself, but here’s one example.
The study found that, though healthier food costs more than unhealthy food in low-income areas, both actually cost less in low-income areas. Advocates, however, routinely cited a study but claimed simply that good food cost more than bad food. The nuance here is an important one, and the authors point out that it was never made.
The authors also discuss a different study that has been cited by advocates that is also not as conclusive as widely reported—the study shows that small grocery stores have more expensive food and a narrower range of options—but doesn’t compare how this plays out by income distribution (low- versus high-income neighborhoods).
Lastly, the authors refer to a 1992 study (also frequently cited) which compared the cost and availability of a basket of healthy versus unhealthy foods in poor and more affluent neighborhoods. The study (ironically, also published by Macintyre) was simply a pilot study and didn’t use random sampling, significance tests, and other statistical methods that a more robust study would have used. It was, after all, only intended to be a pilot study. Macintyre herself points out that it was widely (and wrongly) cited across the UK and America as evidence of food deserts.
I’ll leave you with another quote by Macintyre:
“If the social climate is right, facts about the social world can be assumed and hence used as the basis for health policy in the absence of much empirical information.”
That pretty much sums it up.
In fairness, these studies also raise many questions. Who are the authors, how are they funded, and how legitimate are the claims they themselves make? But the questions posed by the authors of these studies serve to at least merit a closer examination of the relationship between data and policy.
Implications for social change advocates and public policy
What are the implications for those of us who care about social and public policy?
Not being critical thinkers and examiners of data puts our credibility on the line in the arena of public perception. It arms our opponents with legitimate counter-criticism to our views.
It can distract us from other, more viable paths to social change that truly can be substantiated and measured. And it obscures the broader, but as important, good intentions behind our convictions. In this case, for low-income people who disproportionately suffer from poor health outcomes, what are the contributing factors that have been credibly examined (long hours working several jobs, the stress and worry that accompany poverty, or the lack of education about what constitutes good health habits,)? That’s where public policy can be directed.
Valuing proper research, taking the time to understand it, and respecting its limitations strengthens our arguments
It’s tough for me to write this post. I’m Hispanic and I have spent my entire career in the advocacy and public policy field. This is very much my world and I see every day how hard my friends and professional colleagues toil to right the wrongs that society allows. The passion, integrity and commitment that advocates and policy makers bring to their work can not be underestimated. And that’s why I write this, because valuing proper research, taking the time to understand it, and respecting its limitations only makes our positions stronger.
In an earlier post, I wrote about how lack of data literacy can put social change organizations behind the curve in advancing their goals. In this case, it can do the same to good intentions, and good outcomes.
But let me conclude by saying that just because the data may not support the public narrative of food deserts, that doesn’t mean that it’s okay for poor people to eat bad food. That’s a patently unfair situation for those who live in poverty. There are many benefits to eating fresh, affordable fruits and vegetables. I make that assumption from what I read in mostly reputable news sources. I further assume that avoiding high-fat, low-nutrition food that delivers scant nutrition for the money is good for other reasons. At least, I want to believe that. But as good as that sounds to me, perhaps I should do a little digging to substantiate my convictions.
The shooting death of Trayvon Martin, the 17-year-old black Florida high school student who was killed by George Zimmerman on February 26, 2012, spurred one of the most widely reported, painful and controversial public conversations on race and social justice in recent memory. The story started as a local news piece, and quickly morphed into a national debate in newspapers and radio stations; on YouTube, Twitter, Facebook, Reddit and other social media channels; on front stoops, in office cubicles, and at kitchen tables; across marches, rallies and demonstrations; and through online petitions and campaigns. These events coalesced and influenced the actions of news organizations, citizens, politicians and thought leaders in a very public way. This offline/online “networked” public discourse was a far cry from the analog (print, radio) news model of the past.
Understanding how information and news networks relate and influence one another helps you decide where to take your message, and to thus influence and help set the agenda for public debate. This is where today’s social change organizations will succeed or fail in their efforts to remain relevant and effective agents of change.
“The Battle for Trayvon Martin: Mapping a Media Controversy Online and Off-line” study analyzes, piece by piece, each facet of the intersection between the offline and online reactions, advocacy, citizen journalism and organized media coverage of the Trayvon Martin news event, and presents an analysis that takes us to the very epicenter of the intersection between media coverage, online and offline activism on both a personal and grassroots level, and the results through the lens of public discourse. This pioneering February, 2014 study was authored by Erhardt Graeff, Matt Stempeck and Ethan Zuckerman of the MIT Center for Civic Media. The goal of the study is to analyze the evolution of the Trayvon Martin story and to understand the role that activists in how the story played out across offline and online media channels .
Using data to quantify influence in public discourse
To the best of my knowledge, the authors are doing something that no one has done before for traditional and digital media (the methodology will give you a headache, in a good way)—they attempt to quantify and measure far beyond the “clicks” on articles that many of us traditionally use to measure engagement and, from that, to glean our influence over the message (I know I’m over simplifying but not by much).
Rather, they map the spread and cross-pollination of those ideas across all media (offline and online, traditional and participatory) and make correlations around consumption (who is clicking) and engagement (what they do and share afterwards), tracking it all back to the message (how does all of this effect how analog and digital news outlets cover the issue). It’s a fascinating cycle, and one that any organization interested in shaping public opinion and effecting social change would be better served to learn.
This post attempts to translate the findings of the study into takeaways that organizations who focus on social change can use to better understand the correlation between traditional, digital and social media today.
First, let’s take a look at one of the most helpful parts of the study—an analysis of the journalism ecosystem of today.
Yesterday’s traditional news gatekeepers are gone—replaced by “the networked public sphere.”
To be effective, social change organizations need to understand how to work and communicate in what the study defines as the “ecosystem” of news and information today.
I think of this in broader terms—to me it’s more of an information ecosystem. Regardless, it is not the topdown gatekeeper model from back in the day of print news—the managing editor, the reporter, and you—cultivating a personal relationship with a network of journalists to pitch your story. Don’t get me wrong, that world exists. But it has expanded by so much that if you don’t understand where else others are engaging, you’ll be talking to an empty room, albeit a virtual one.
The study underscores this by helpfully describing the new world of media as an ecosystem rather than an environment. The distinction may be lost on some of us, but the definition the authors present is clear.
“[Today’s media ecosystem] is not monolithic or hierarchical—[rather] dynamic networks of media linked together by transmedia audiences [those who hop from one media and social platform to another—my take] coalescing around particular stories at particular times, [following] literal hyperlinks [to seek] the most influential source at a given moment.”
So what comprises digital media today? The study emphasizes both professional content (journalists) and amateur content (“citizen journalist” bloggers, for example). Add to this, everyone—those who write 50-word posts on Facebook that get shared, Tweeted and discussed; 140 characters on Twitter, those who post Instagram photos and opinions; the discussions on Reddit, etc.). The authors describe this as “the networked public sphere.” And it’s a big universe with lots of moving parts. If you’re trying to control it, give up (that’s yesterday’s model). If you’re trying to be a smart influencer, read on.
The traditional gate-keeper role of the media has been upended by the democratization of information, which gives social change organizations the opportunity to seize and set the agenda of public discourse.
What’s cool about this networked public sphere model, and critical for social change organizations to understand, is that it presents unheralded opportunities for these organizations to actually set the agenda for public discourse. As noted above, the traditional gate-keeper role of the media has been upended (to a degree) by the democratization of information. If social change organizations (and more importantly, the individuals who serve as their advocates and ambassadors) choose to engage in digital media (carrying out conversations and sharing information on Twitter, Facebook; pushing cultivating relationships and content with bloggers, etc.,) their message becomes the news, and they get to frame it.
Use social media effectively and your message becomes the news—you get to frame the debate.
The study references recent media research around the revolution in Egypt (2010), and likens the Trayvon Martin story to that revolution, in terms of how it played out across all media and public dialogue. For example, the authors cite how Twitter’s #egypt hashtag reflected a blend of both personal political expression and a more conventional media push around a central message. To me, the Twitter conversation represents a hybrid of these formerly distant messaging cousins (the individual and the media outlet).
Think of it this way: Twitter users pushed out their own message about the revolution framed in a way that expressed their common sentiment, then the more “authoritative” (traditional) media outlets began reporting on that “framed” message, and that particular framing was—in turn—disseminated even further by the readers of those outlets. This is one way in which social media is influencing how even traditional news media are shaping and forming the message behind a story.
Data tools used to track and analyze coverage
To trace the path, evolution and influence of the Trayvon Martin story, the authors use Media Cloud and Controversy Mapper (which are, by the way, two tools developed by the authors in conjunction with Harvard’s Berkman Center for Internet and Society.) This is good stuff (case in point: Controversy Mapper’s data visualization on SOPA/PIPA)—imagine being able to analyze not just what the media is covering but how (the message, the interpretation, the framing, the influence) in a rigorous, quantitative way. Well, they did that.
Media Cloud collects articles from more than 27,000 mainstream media outlets and blogs, and follows and tracks links mentioned in these sources to explore the coverage even further. Archive.org’s TV News archive helped the authors analyze broadcast TV (they mine transcripts of broadcast TV). On the digital side, the authors also used Google Trends to analyze searches, General Sentiment to track Tweets and hashtags, and the url tracking and shortening tool, bit.ly.
Data that the authors examined
First the broader media coverage: social media and professional news outlets. The authors examined the number of times the story was referenced, Tweets and hashtags, TV, Google searches for the subject, location of coverage (e.g., front page indicating editorial prioritization) in national papers, and the public’s online activism (for example, a petition on change.org). The methodology and data collection were far more involved than my crude summary attempt. Because the goal of this post is to translate the study for a more general audience, I don’t do the methodology much justice. It merits a closer read.
Trayvon Martin
Let’s shift to the Trayvon Martin story. As you know, this unfolded offline initially—it was local—hyperlocal at first, narrowly framed and, as the authors describe it, “a fight between two people in an area known for occasional violence, stood little chance of attracting significant media attention.”
An initial amount of national media coverage gets returns
Why then, didn’t the story die? The difference was the immediate and unrelenting efforts of the Martin family to share their story. By quickly retaining Benjamin Crump, a pro bono civil rights attorney (interestingly, one who, according to the study’s authors, ascribed the failings of a previous probono effort in part to an inadequate media publicity strategy) who brought on a local attorney who, in turn, recruited a pro bono publicist (Ryan Julison). Julison was able to get coverage from two national media outlets, which later snowballed into other national media.
From a fraternity listserv to a national online petition: Leveraging online activism yields big results
According to the study, the story (spurred by the initial limited national coverage) was mentioned on a Howard University listserv. A Howard law grad got involved and launched a Change.org petition. His rationale was the lack of national coverage. He emailed his petition to other students at the university. Yep, email is how this got started.
More national coverage, social organizations step in, and Change.org becomes “an early leader” in media attention
The Huffington Post, Global Grind, a self-described multi-racial news and lifestyle website and activist organizations (ColorOfChange and the Black Youth Project) began covering the story, described by the authors as “early amplifiers.” As a result, the change.org petition began picking up speed (growing from 217 initial signatures on day one—March 8—to over 30,000 signatures five days later (March 13).
Change.org attracts celebrities, and even more attention
Something interesting happened on the sixth day after the petition was launched. A change.org employee asked a target group of celebrities whom he thought would be sympathetic to the cause to share the petition with their fans (Mia Farrow, Spike Lee, to name a few). They were interested, and they did share—to the tune of over 80,000 signatures a few days later (a 900% increase in signatures over the course of 3 days, according to the authors of this study).
The shift to mainstream media as the news authority on the story
The pattern until March 17 (when the publicist released 911 tapes to the public and the media) was as follows: low-profile, hyperlocal news story; narrow coverage on a national level that spurs a rapid rise of personal and social activism; which yielded high-profile coverage by celebrities and a resulting increase in national coverage.
When the probono civil rights attorney (Benjamin Crump) released the 911 call to the media, coverage—particularly in mainstream broadcast radio and TV—predictably mushroomed. The authors of the study specifically point out that the audio nature of the 911 call may have made it more appealing for radio and TV to cover.
But social change and race-based organizations and celebrities continue the momentum
Reddit’s /r/blackculture subreddit featured the change.org petition and Reverend Al Sharpton’s involvement continued the publicity. By now, civil rights and political leaders all over the country were taking up the charge through political demonstrations and rallies. The authors cite the Million Hoodie March in New York (spearheaded by a digital strategist) as a catalyst for more coverage. Interestingly, the authors point out, larger media didn’t feature the story on their front pages until after the march, positing that the actuality of the march made for an easier story to cover.
News hooks in traditional media need “real” events
There’s an interesting pattern here of mainstream media not covering the Martin story until something “real” happens (the authors describe these as “actualities”). Note how radio and TV began covering the story after an audio recording was released, and front page newspaper coverage began after an actual march took place. After Zimmerman was finally taken into custody (another “real” event) six weeks after the shooting, newspaper coverage peaked.
Who influences how a message is framed by national media outlets?
Let me answer that simply—it’s not the media outlets. Nowadays, the spin on a story often takes place outside of national media news sources. Frequently, by the time they report on something, they’re simply capturing what has already happened.
So if you want to influence how the a major news outlet writes a story, your message can begin in social and digital media, and with your activists and ambassadors.
Let’s look at how the conservative movement was able to influence the debate. The study cites how one notable conservative blogger (Dan Linehan, of the Wagist blog) claimed that Trayvon was a drug dealer. As you would expect, this message was spread and picked up by like-minded right-leaning blogs, and eventually did make its way to mainstream media (the Miami Herald), where it was amplified. So, regardless of the accuracy of the claim (and it was not credible), right-wing bloggers became effective ambassadors to mainstream media.
The study’s authors actually cite research that shows that repeating a myth in order to deny its credibility may have the opposite effect.
“Research has shown that restating a myth in order to negate it can actually produce familiarity and thereby help further propagate the misinformation.”
This has strong implications for social change organizations of all stripes—the public debate is often played out as a series of narratives that are alternately supported and refuted by proponents and opponents, respectively.
Two graphics show the networks of media that mentioned “marijuana” (figure 8 in the study) and “drug dealer” (figure 9) during this period (notice how prominent the right-wing Wagist bubble is in both graphics.) The large size of the Miami Herald bubble signals high frequency of news mentions of the word “marijuana” in the story; as does the similarly large sized Wall Street Journal bubble (“drug dealer” in the same context).
Figure 8: Network of interlinked media mentioning ‘marijuana’ as taken from the authors’ study
Figure 9: Network of interlinked media mentioning ‘drug dealer’ as taken from the authors’ study
How opponents can inadvertently strengthen your messaging goals
What’s interesting is how left-wing blogs and organizations join the fray and, by refuting the right-wing claims, nonetheless continue to keep the negative framing in the limelight, as evidenced by the largish bubbles that represent ThinkProgress.org, for example. The author’s conclusions:
“This suggests a strategy for reframing a story—if an activist is able to gain mainstream coverage for [framing a message a certain way], opponents are likely to respond, [thus] perpetuating a debate that features the desired framing [of the activist].
Remember, these two graphs reflect the prominence of Trayvon Martin and the words “drug dealer” and “marijuana,” an association that his supporters deemed undesirable. All started by a right-leaning blogger, perpetuated by those who countered the claim, and widely covered (eventually by papers ranging from the Wall Street Journal to the New York Times).
Piggybacking to a related cause: Stand Your Ground Laws under attack
The authors describe how an organization with a different focus, The Center for Media and Democracy (CMD), a left-leaning organization, injected its concerns about the influence of the American Legislative Exchange Council (ALEC), a conservative lobbying organization that became an outspoken proponent of the “stand your ground laws” that were used in Zimmerman’s defense of the Trayvon Martin shooting) into the debate. The Center for Media and Democracy had launched a campaign against ALEC prior to the shooting but used the controversy to strengthen its campaign. And like-minded progressive organizations formed a cascading effect, as they piggybacked off the Center’s research to pressure corporations to withdraw ALEC funding. Eventually, even Paul Krugman of the New York Times wrote an op-ed (March 25) about Trayvon and the Stand Your Ground Laws, and change.org followed suit with many petitions to dismantle these laws. According to the authors of the media mapping study, on April 17 ALEC terminated its controversial task force on those laws.
Correlation between digital and traditional media coverage and reader engagement: All news sources tend to cover issues even after reader interest wanes
The study’s findings show that all media sources, (traditional and digital) are roughly correlated (when one was covering the story, so were the others)—this extends to news articles, TV coverage, searches, petition signatures, and clicks to links (via bit.ly) on this coverage. The conversation on Twitter appeared to peter out after a while, and the authors speculate that this was either because campaigns had used Twitter early on or simply because social media may be quicker than other mediums to move away from one story to the next. Overall, however, the “tail” of news coverage went beyond actual reader engagement (sharing, clicking on links to articles, etc.) which the authors believe may indicate that readers simply lost interest even whilst the media continued coverage.
Conclusions:
1. Broadcast media still matters.
Broadcast media amplifies (spreads the story through coverage) and serves as a gatekeeper (what it chooses not to cover has a harder time getting out into the public debate, and how it frames what it does cover tends to stick). But activists who use other media channels and platforms (petitions, social media, blogging, leveraging like-minded organization and allies, personal networks) are now solidly influencing how the message is shaped and formed (framing).
2. Social change organizations can spin traditional media for their own purposes.
Even though broadcast media still serve as strong gatekeepers to what does/doesn’t get covered and how it is framed, smart organizations leverage existing coverage to inform their supporters, piggyback off the coverage to mobilize their allies, and spin it (reframing) to meet their own messaging goals. And, from a messaging perspective, it’s promising, as evidenced by how successfully many Trayvon Martin proponents were able to shift the media narrative (the outcome of the trial is another matter).
3. The blogosphere covers issues long after broadcast media coverage peaks.
Smart organizations know this, and court bloggers accordingly, understanding what motivates them to write and when. So understanding who is blogging (or has the potential to blog) about your issues and cultivating those relationships is key.
4. Contemporary news outlets today are increasingly more likely to get the maximum out their investment of time and journalists to cover a story.
News outlets will cover a story even after readers have disengaged. Don’t get too excited. This has not been covered in a flattering light (see McJournalism).
5. Social media can create related micro-stories from broader events.
These micro-stories then become news events in themselves and create a longer tail for the original story (the Million Hoodie March, for example).
6. Social media can side-step traditional media gatekeeping functions if you have good content.
Some social media platforms that are particularly well-suited to a specific type of content (YouTube or Facebook for video-sharing, for example) quite powerfully and effectively side-step traditional media’s gatekeeper role, and thus are demonstrably able to shape public opinion. Organizations that know how to create relevant content for these and other platforms can get their message across in huge ways.
7. Social media is so much more than spreading the word.
Because it is so heavily reliant on personal interpretation (one person sharing his or her opinion about a news event, in addition to simply sharing news of the event itself), social media is a powerful force in shaping the message and framing—and the public perception—about an event.
8. Deviant discourse: Social media upends the traditional notion that mainstream media are, indeed, the gatekeepers for news content and opinion
This has its downfalls. In the past, gatekeeper news organizations simply wouldn’t cover extreme views that were a small minority of public debate. Today, if enough people talk about it, it does indeed become mainstream news (the authors point to the widespread coverage of Obama’s citizenship as a case in point). The authors explain this “deviant discourse,” as they put it, brilliantly, and it’s worth quoting here:
“Our work suggests a mechanism through which social media users introduce potentially deviant frames into the mainstream: they harness ideas to a high attention story already underway and attempt to direct the attention generated by the story towards their interpretations and views.”
9. Use finding #8 (above) for good, and not for evil, okay?
(My opinion; not the authors’.)
Hope you enjoyed this post. Mad props to the geniuses at the MIT Center for Civic Media for this incredibly data-rich study. Mindblowing stuff.
These days, you can throw a rock and reliably hit any number of articles and headlines proclaiming the power of big data, open data, and transparency. The acceptance and adoption of using large, public sets of information to make informed decisions represents a sea change in how the corporate world, inacademia, think tanks and large NGOs are investing in their capacity to crunch more than numbers. No surprise there. But how does the little guy—the small grassroots organization with a small budget and a big mission around social change—fare?
I’ve been thinking a lot about this lately. Last year, I made a job shift. I moved from a very large, well-funded nonprofit to a relatively small healthcare advocacy organization. In my old job, I worked in data visualization and regularly called upon the considerable financial, technological and statistical resources that my employer afforded me. Today is a different story. I work with supremely talented and passionate people, but the data resources that I once took for granted are gone. The “data divide” is now staring me in the face. And that’s the reason for this post—the reality that, for all the promise that big data and technology claims to offer, many of today’s smaller nonprofits and grassroots organizations are not equipped to collect, understand and harness information to move their social mission. We are the “have nots” who look out onto the world of the “haves” with statistical modeling tools, economists or statisticians on hand, coders on staff or on contract.
The data divide—what is it?
The “data divide” is by now a familiar term to many of us. The Guardian wrote about “data apartheid” when it reported on the findings from the recent 2013 Open Data Index last November. Similar findings are in the Open Data Barometer 2013 report released late last year too. And we know how it exacerbates problems faced by developing countries in fostering an open, transparent government and an informed, participatory citizenry. As I wrote last year, a good example of how open data helps citizens overcome these hurdles lies in how La Nacion (Argentina’s national newspaper) teamed up with data journalists to publish data on a variety of indicators to the Argentine public—despite the government’s lack of a Freedom of Information law.
Data divide: Access to data does not translate into results
In a blog post dating back to 2011, Mike Gurnstein describes the data divide in a way that many health care advocates are talking about healthcare today. In discussing the Affordable Care Act, advocates regularly say that access to health care is not enough—it’s the quality of care that matters. And there is an entire movement around health system reform that underscores this. Gurnstein makes a similar point about data: “[A]ccess is not enough,” he writes. “[I]t is whether opportunities and pre-conditions are in place for the effective use of the technology particularly for those at the grassroots.” Go Mike. I haven’t a clue who you are, but you nailed it.
In the same way in which the “digital divide” of the 90s and 00s required education and digital literacy to make real the opportunities that online access offered, bridging the data divide for small organizations relies on more than making data available, but also in affording these groups the ability to use it effectively through knowledge (data literacy—an understanding of how to read data and how to represent/visualize it effectively for a common purpose) and resources (the realization of this understanding into actual tools).
How can data help grassroots organizations and smaller nonprofits?
Here in D.C., Applied Predictive Technology (APT), a tech firm that sells predictive analytics software, volunteered to analyze the data that a local charter school was collecting from the tablet apps that its students were using. APT used this “data dive” to help teachers assess how well the tablet reading apps were working for different kids—allowing teachers to tweak the reading curriculum and apply intervention to different types of students.
One of the best organizations out there is New York-based DataKind. If you really want to understand how socially-conscious data scientists are working to achieve social change through data, take five minutes to check out the variety of projects they work on. Over the past several years, DataKind has been launching “data drives” in cities around the U.S. Similar in nature to “hackathons” or “code-a-thons,” these DataDives team up volunteer data scientists/analysts and social organizations over the course of a few days to build apps or software that solve a well-defined data problem. And then they solve it.
When DataKind held a DataDive for D.C. Action for Children, a small organization that collects data on the indicators that affect the well-being of children to mitigate poverty, good things started to happen. The nonprofit also runs the DC chapter of the Kids Count program and, through Kids Count, it was doing a great job at collecting data (that was their mission). But the work that they were producing was static—PDFs—a situation common to many small organizations. Fortunately, they realized that, to make the data meaningful, easier to analyze, and more effective at highlighting the poverty problems that needed to be solved, they needed to visualize it. This is where DataKind came in. Their volunteers worked for a month to create an interactive data visualization tool (eDatabook) that mapped the well-being indicators and poverty clusters across the District. The best part? It’s replicable. Other DC Count programs across the country can adopt it as well.
Using data and hackathons to help on a local level
The vast global data modeling regularly published by the World Bank is impressive. But municipalities are using data to tackle local problems too. Like D.C. Action for Children, cities are pairing up with volunteer data analysts and coders to sidestep the issues of inhouse capacity and expertise.
To fight ongoing problems with obesity and diabetes, for example, New York City launched its first health data code-a-thon this past December. The result? An app called “Vera.” Based on a user’s risk for diabetes, Vera texts users reminders and tips for physical activity, glucose monitoring and even good food intake.
Leveraging hackathons for broader impact
Voting: On a broader scale, the Voting Information Project, a small group of elections experts who focus on improving the voting experience for the public through cutting-edge technology, held its first hackathon in November, 2013 (disclaimer, I was affiliated with the organization that funds this project). The hackathon yielded fast and effective results, including first-ever voter lookup tools, that were used by Americans everywhere.
Healthcare: On June 2, 2014 Health Code-a-palooza will bring together programmer teams who, over the course of 48 hours, compete to see who can use a Medicare data set to build the best app for doctors to use to improve the quality of care that they deliver to patients. This hackathon is part of the Health Data Consortium’s annual Health Datapalozza, an event that features data and healthcare experts discussing how open data can drive meaningful improvements in the health reform movement. But you have to admit, the coding is pretty cool too. If you’re interested in learning more about how open data is playing out in the field of healthcare, read more about the Health Data Consortium.
Challenges and questions around transforming the data culture in small nonprofits
Lack of data literacy can impede an organization’s ability to articulate its need.
As I mentioned, part of the problem is not just access to data, but being able to frame a goal, understand which data to collect and establish good collection practices—data literacy. For an organization taking nascent steps toward data collection, this can be daunting. It requires a change in the organization’s culture, investment of time (if not technology and staff) and a reprioritization of traditional methods of executing its goals. Much of that work is internal. But some of that can be helped by organizations such as DataKind’s, who actually mentors organizations to help them frame their problem and prepare for the end result.
Sustainability beyond the initial volunteer effort
And what happens after the project concludes? What if something breaks? How do you continue to foster an environment of learning and change in an organization after it takes its first steps toward a data culture? Again, an approach like DataKind’s is promising. They stick around, monitor the project and provide follow-up support to ensure that the work keeps going. That makes sense, because it’s part of DataKind’s mission. In future posts, this is something that I’ll be writing more about, as well as how data volunteers and organizations are finding each other. If you’ve got ideas or stories to share, let me know. You can follow me on Twitter at @uriona.